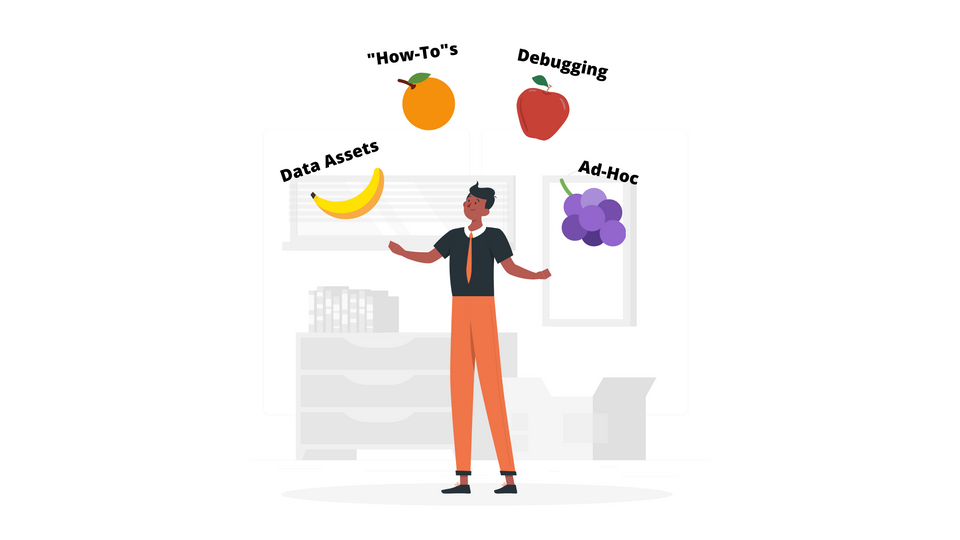
Imagine juggling three oranges. You start getting into the rhythm, and suddenly someone throws you another one. Then another. They just keep on coming. Every time you receive another orange, juggling becomes more difficult, especially since they’re appearing spontaneously. Now imagine that you’re starting to catch different types of fruit. You might be juggling an apple, a banana, or perhaps some grapes. You’re still able to juggle them all, but their varying shapes make them harder to manage.
That’s how analysts feel when they receive tasks throughout the day. Not only are they managing a large number of tasks, but those tasks are extremely diversified and range in complexity. Each type of task requires its own special process, a different set of tools, and communication with various stakeholders. Managing and adapting to each circumstance is highly challenging, even for the most skilled employee. Additionally, analysts are likely to be juggling all of these tasks at once — a stressful situation that makes it hard to find time to think about how to solve each one.
After analyzing and working on thousands of these tasks, we have divided them into four categories: data asset development, ad-hoc requests, “how-to”s, and debugging. Here are the best approaches to solve each one:
1. Data Asset Development
What are these tasks?
These are the tasks that analysts really signed up for when they took their jobs. They are long-term, strategic, and impactful initiatives that involve building or adding features to data assets such as dashboards & automated reports, advanced analytics (predictive modeling, researching, statistical analyses), and data pipelines (ETLs, data sourcing, longitudinal datasets).
How do we solve them?
- Treat them like proper development projects that are producing data assets.
- Coordinate with relevant stakeholders to dive into the objectives of the project and the research analysis it will comprise.
- After determining the requirements and processes, prioritize against other long-term projects according to the expected impact and effort.
- Proactively work with data engineers and software developers to collect data in the appropriate format, and stay organized throughout the process by keeping all of the information you need in one place.
Before creating the data asset, outline the best way to build and present your output. It could be through text, visualization, or Excel workbooks. It also depends on whether your stakeholders prefer access to the underlying data, or if that might confuse them. A best practice is to suggest a few options and let them choose, as this will save time on design and editing iterations. If possible, consult with your technical peers as well, and take their advice into consideration.
Once you answer the root question, build a lo-fi version of the data asset with limited formatting (no one will care if your column doesn’t have the dollar sign in it). Generally, we recommend testing in code and tables before spending time building an extensive dashboard with numerous features. That said, if you are required to build a complex dashboard, consider using a notebook to properly guide your stakeholders through the data flow.
Finally, test what you’ve created with your stakeholders and make sure that you fully understand their feedback to improve the data asset accordingly. Also, remember to update them if there’s any change in progress or expected delivery. Continue developing and testing the data asset until both you and the stakeholders are satisfied. Once you’re done, document your work for future use and market the project to additional teams in the organization that might be interested. This will increase the return on your data investment. To increase the lifespan and usability of your work, ensure you monitor for changes and maintain the asset when needed.
2. Ad-Hoc Requests
What are these tasks?
These are the most common types of day-to-day tasks. They include requests that business stakeholders send over when they are looking for insights that may help them better understand the market or the impact of their work. They are less complex than the previously mentioned tasks, since you can use or build on existing data assets to address them. Sometimes the task is to answer specific questions, such as “how many users did we onboard last week and how many are still active this week?” Other times, the task is to produce simplified reports that summarize a large number of data points in a digestible format, such as “show me cohort retention curves by country.”
How do we solve them?
First, allocate a block of time during the day to focus on answering these requests. If you don’t set aside specific blocks of time, it’s easy to find yourself getting pulled into ad-hoc requests all day long, distracting you from making progress on your strategic projects.
The most important step is to prioritize your tasks. Prioritization can be based on the urgency of the request, the time and effort needed, or the stakeholder who requested it. It also involves determining whether a request is “need-to-have” vs. “nice-to-have.” The latter are often sparked by curiosity, but aren’t always important.
Next, set expectations with the stakeholders around the deliverable requirements. This includes defining the information that they’re interested in and the estimated time of delivery.
After that is done, search for relationships between the tasks. For instance, do they use the same query or downstream table? It is ideal to minimize the inefficiency of context-switching. Jumping between tables, schemas, and tools will only add additional, unnecessary overhead. Clustering tasks into relevant groups will help solve similar tasks together while the queries and schemas are still fresh in your mind.
Once the tasks are grouped, identify the best methods to resolve them. Is it by writing code (SQL, R, etc.)? Or reconfiguring a report? Also, it is useful to look for previous work that you may be able to repurpose by copying, cleaning, and adjusting. This will save you chunks of time and be much more efficient than starting from scratch. Then, send the results over to the stakeholder and ask for their feedback. Adjust if needed and save your work in an accessible location for future reusability.
Ideally, there should be a periodic review of these documented requests to search for common themes that could be addressed with the creation of a new data asset or a larger strategic project. For example, if the finance team asks about the number of paying users in Q1 2020, a product manager asks about the number of paying users on the iOS app, and a marketing manager asks about paying users by city, it would be more efficient to create one “paying users” dashboard for all.
3. How-To’s
What are these tasks?
How-to’s are Wiki-style questions that stakeholders ask to understand how to use the spreadsheets, reports, and dashboards that you have developed for them. Although analysts invest a great amount of time making their reports straightforward and user-friendly, less data-savvy stakeholders often have trouble understanding them and extracting the exact information or insights that they need. That’s why they often come to you with questions such as “How do I filter?”, “How do I export?”, “How do I know when the report was last updated?”, and “How can I change the visualization?” Sigh…
How do we solve them?
Confirm that all required information is already included and available in the report, then create a personal Q&A library in Google Docs or via some internal software. Document all of the answers that you provide, since identical questions are often asked by other (or even the same!) stakeholders regularly. Ensure that your answers are as detailed as possible to limit superfluous back-and-forth communication. You may want to include some screenshots to guarantee that everything is as clear as day.
Well-defined work processes around how-to questions can tremendously reduce the time you invest in redundant work. The main key is to be organized. Once all of your Q&As are organized, you can direct stakeholders to the relevant documentation and allow them to self-serve, with minimal effort. If they still can’t find what they need, consider investing in creating a new document, which can then be added to your library for future use.
Finally, own your documentation. Write your name on every document that you’ve created. This will make it easier for stakeholders to understand who they should talk to in case they run into problems. It will also help keep you accountable for your areas of ownership. Changes will happen regularly, so designate time within your work process to update your documentation.
4. Debugging
What are these tasks?
In short, debugging refers to troubleshooting problems. Like it or not, errors are inevitable and bugs will appear in your analyses, SQL, ETLs, and tools that you’re using. Debugging tasks can take a long time to solve– days, weeks, and sometimes (mainly with legacy systems) even months. You will recognize these tasks when you receive comments such as “These numbers don’t add up” or a panicked “I opened the dashboard and it’s all blank!”
How do we solve them?
The key is to address these tasks in an extremely organized manner. You’ll need to go back and review your work carefully to identify the errors and find exactly where they are located. The best place to start is at the bottom, and then work your way upstream until you discover what is causing the bug. Create a step-by-step process that you follow whenever a problem arises. Here is an example of how debugging a pipeline could look:
- The BI Tool: Is it down? Are there any other reports that are dependent on the same underlying data, showing inconsistent numbers? Is the BI tool vendor reporting any issues? What about the data connectors to the downstream tables? Can you check them from the BI tool?
- Downstream Tables: Are they slow to load? Do the numbers in them make sense? Use a test query or filter for each table to see if they’re producing the correct results. Document the test queries and their results.
- Data Warehouse: Is it up and running? Are the transformation scripts that create underlying dependent tables working as expected? Check for column changes (name, data type, etc.), evil little devils.
- ETL: Are the data source API connections throwing errors? Were there any scheduled jobs that failed to run?
- Data Source: Did anything change with the data formatting or payload? Was there a modification in one of the columns? What about the credentials used to pull data from upstream sources? If the data is coming from a third-party tool, check to see if there are any reported issues.
While you’re going through the process, record the results and problems in one place. Since your data is interdependent, having all of the issues consolidated in one place will help you better pinpoint the root cause. Then, timebox work for each bug based on severity to avoid going down rabbit holes for low-priority issues. After working methodically through the bugs, run the step-by-step process again to verify that no collateral damage was made.
Debugging is a team effort. If data engineers or developers are involved in the process, definitely work with a ticketing system or project management tool to manage the tasks efficiently. It’s also important to define who owns each step of the process within the data team.
With your business partners, communicate your findings regularly to reassure them that you’re taking care of the problem.
We would love to hear about your experiences with these tasks! Are there any other types that you spend a considerable amount of time on? How is your capacity divided among these tasks? Which types do you find to be the most challenging and why? Do you have any additional strategies for tackling them? Drop us a comment here or message us directly at coffee@hirupert.com.
These strategies will help you solve your tasks more efficiently, but they can become cumbersome processes to manage. Without the proper support, the myriad of tasks you’re working on will become overwhelming and cause delays in your overall productivity. That’s why we created Rupert. Want to learn more? Check us out.