
Anomaly detection has become the go-to way to monitor data. It’s available in pretty much every tool that deals with data in some way [yup, guilty as charged- including Rupert]. It is extremely appealing as it is fairly automatic and can be quite accurate - it “learns” the data’s behavior by itself and doesn’t require too much intervention. But this magical technique is sometimes not the right choice.. In order to know if anomaly detection is the answer, you need to ask the right questions.
BTW - If you need a refresher or a light intro to anomaly detection - scroll down 🙂
USING ANOMALY DETECTION BE LIKE
Anomaly detection is used to classify the current/ future [predicted] data observations/ events based on the learnings from historical data. This means that in order for the model to work and identify current-time anomalies or predict them in advance - it needs to get historical data or alternatively learn for a while. The more available data it has - the more accurate its output will be, so in general - be patient with it.
You can also affect its output by tuning some parameters based on your knowledge of your industry or specific use cases- you can specify the relevant seasonality, change the model sensitivity to change, set expected value caps and adjust the lookback period for training.
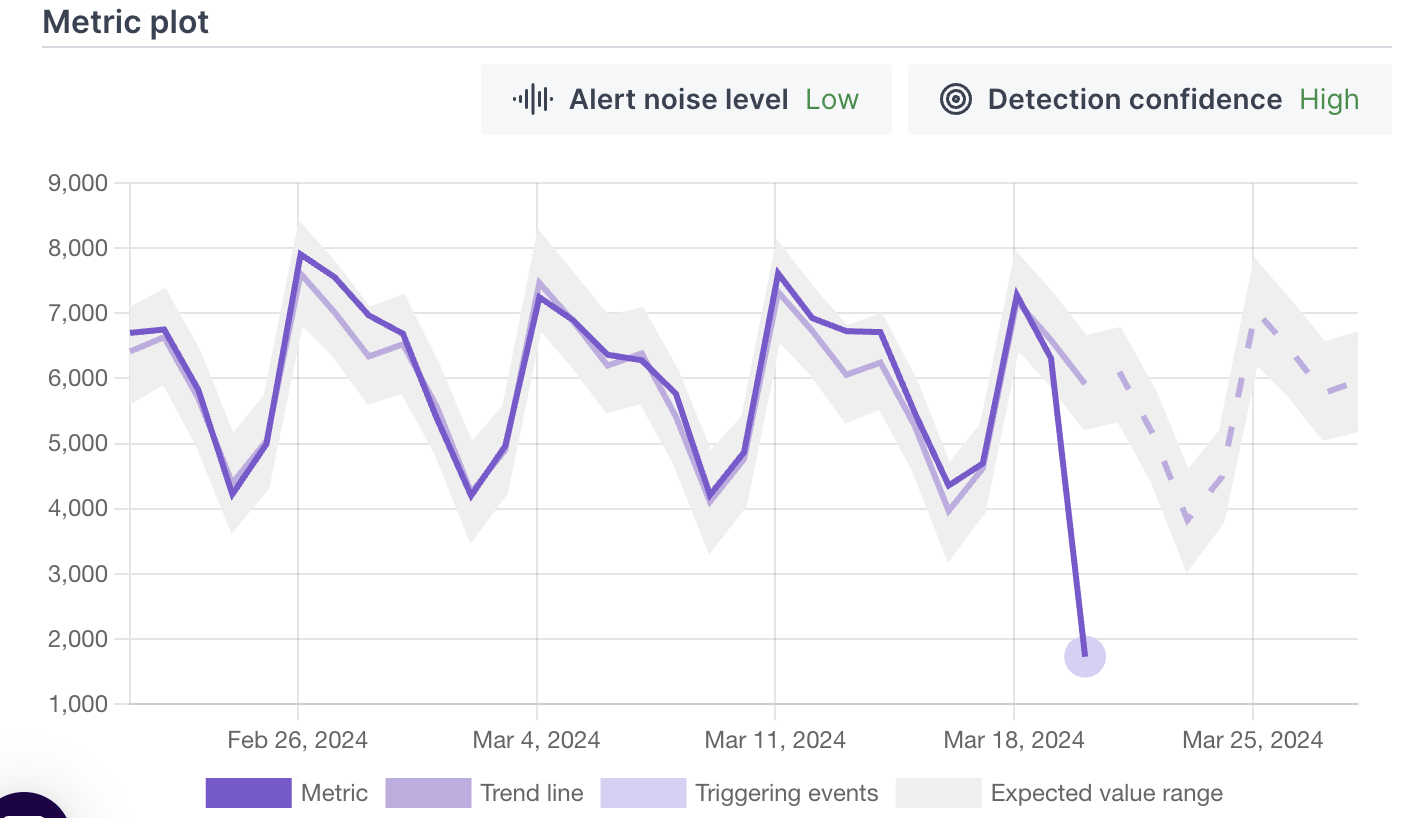
In some cases, no matter how much you try to extend the model’s past learning or optimize its priors and params - you end up feeling it’s not “it” - anomalies are identified too often or are far too rarely and you start asking yourself if this is the right way to go…
YOUR DECISION FRAMEWORK
Every time you need to decide whether or not to use anomaly detection for your data monitoring - ask yourself the following questions:
- What are you trying to identify with your monitoring?
- Are you trying to identify outlier events or abnormal metric behavior? - For example: critical event just occurred [some network gateway errors are peaking and it might be down] or some calculated metric got a weird value after the last ETL [company’s revenue is down by 30% comparing to last week] for these cases: anomaly detection would be a great fit!
- Do you want to be alerted to frequent (but important) events or a changing trend of some metric? - For example: new customer joined the product [which is hopefully not an anomaly for you!] or some organizations are starting to reduce the volumes of transactions they run by your payment service [you want to know when the trend starts - so you can stop it, and not after the customer has churned!] - In these cases, rule based control will make sure you don’t miss out on these more common or “subtle” events - and you are able to react to them quicker.
- What does your data look like?
- How many variations can be in identifying your “triggering” conditions?If your triggering conditions are known and don’t have potential variants - define them specifically with rules. This will give you the best control and clarity. However, for less predictable and varying triggering use cases - the defined heuristic is as good as the domain expert who configures it and might quickly turn out as partial or too noisy - and it’s better to let anomaly take it and automatically generalize all considerations - even the ones you’re not aware of.
- Who are the potential stakeholders that care about your monitoring results?
- Who are the stakeholders you are sharing your monitoring results withIf they are non-technical people - oftentimes using a black box like anomaly detection can be harder to explain or justify.For example: approaching a customer success manager with some anomaly that was detected with some high profile customer’s behavior [such as - “Anomaly was detected in a high-profile customer tokens consumption”] is less compelling or clear than specifying the exact change that was detected [such as, like “a drop of 20% comparing to the moving average of the customer tokens consumption”].
For those who need a refresher:
JUST BRIEFLY - WHAT IS ANOMALY DETECTION?
Anomaly detection is a computational technique to identify events or observations that deviate from the “normal behavior” of the dataset. In today’s world it is usually implemented via unsupervised models - models that do not train on a “labeled” data set telling the model what is a “conforming” observation and what is “deviating”.
Unsupervised models infer the deviations autonomously using different techniques [like smoothing, de-compositions and other scary words]. Most of them essentially understand the main pattern that “most of the input” is following and provide scoring per observation based on deviation from that pattern, where high scores are considered anomalies [this is over simplifying but really the logical base of the theory].
In time series data, These “patterns” are based not only on the general trend, but also considering its change over time and seasonality [seasonality can be periodical by days of week - for example: Mondays behave differently than Sundays or it can relate to holidays and special events].
